

Life
Paid articles are expected to launch around the end of August: this week at work, I've been gradually organizing my past research and my watchlist. I plan to start rolling out paid articles in the next 1–2 weeks. These will include deeper analysis of individual stocks, my views on industries, the macro economy, and U.S. business, and I'll also be sharing more of my own results on quantitative strategies. If you're interested, feel free to DM me or leave a comment about what you'd like to see.
During this deleveraging move, I've heard about quite a few young investors who — because they were over-leveraged — lost 80–90%, and some were even forcibly liquidated. And that's actually the mild version. What we should really worry about is that if AI demand starts to slow, many individual stocks could fall by more than 80–90%. That's what we need to prepare carefully for over the next 1–2 years.
Content
Do we need to worry about CSP cash flow?
NPO back in focus
What I read: Risk and Reward
Market
Do we need to worry about CSP cash flow?
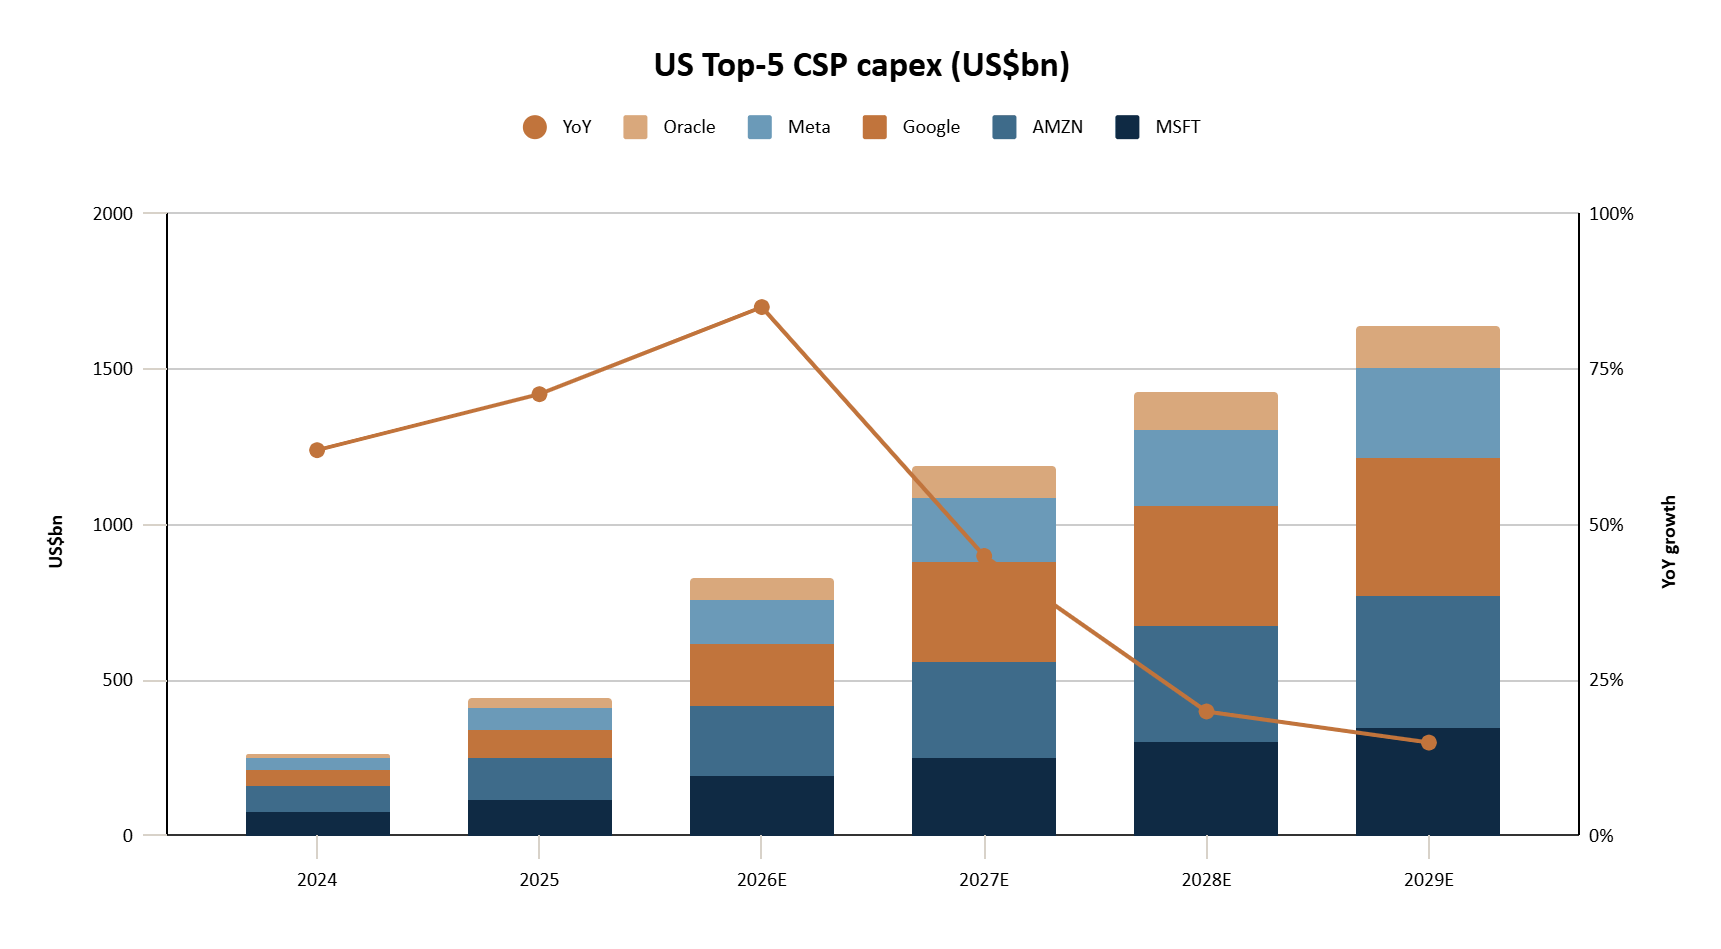
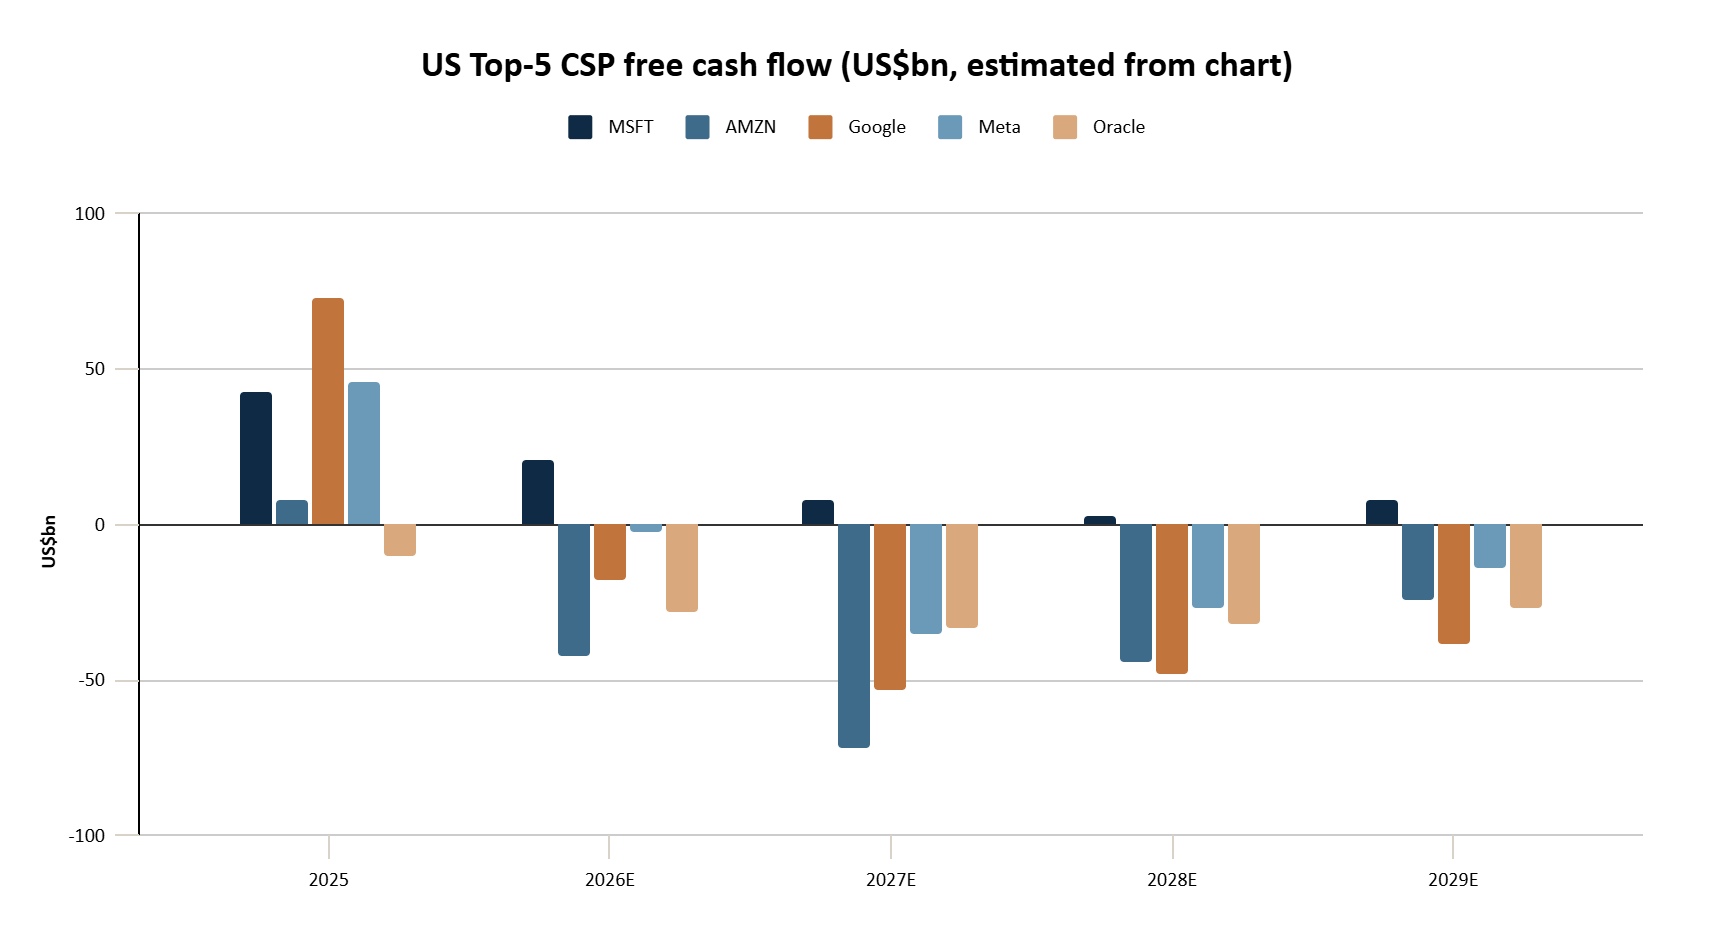
The major CSPs have all reported Q2 earnings and held their conference calls. The market’s biggest concern is that these companies are burning cash so fast that one day it might all blow up — especially now that the big players’ free cash flow could turn negative next year, with heavy financing used to cover all that Capex. We took a close look at this.
Apart from Microsoft, Google, Amazon, Meta, and Oracle will all see free cash flow turn negative from 2026 to 2028, with the trough in 2027.
Should we be worried?
All of this Capex is built only after contracts are in place. Looking at it from the RPO angle: Google’s cloud order backlog grew from $462 billion to $514 billion within a single quarter; Oracle’s RPO (remaining performance obligations) stands at $638 billion; and Amazon says that “most” of its 2027 AWS compute capacity has already been reserved by customers.
Current bond market appetite and spread widening are still within a manageable range.
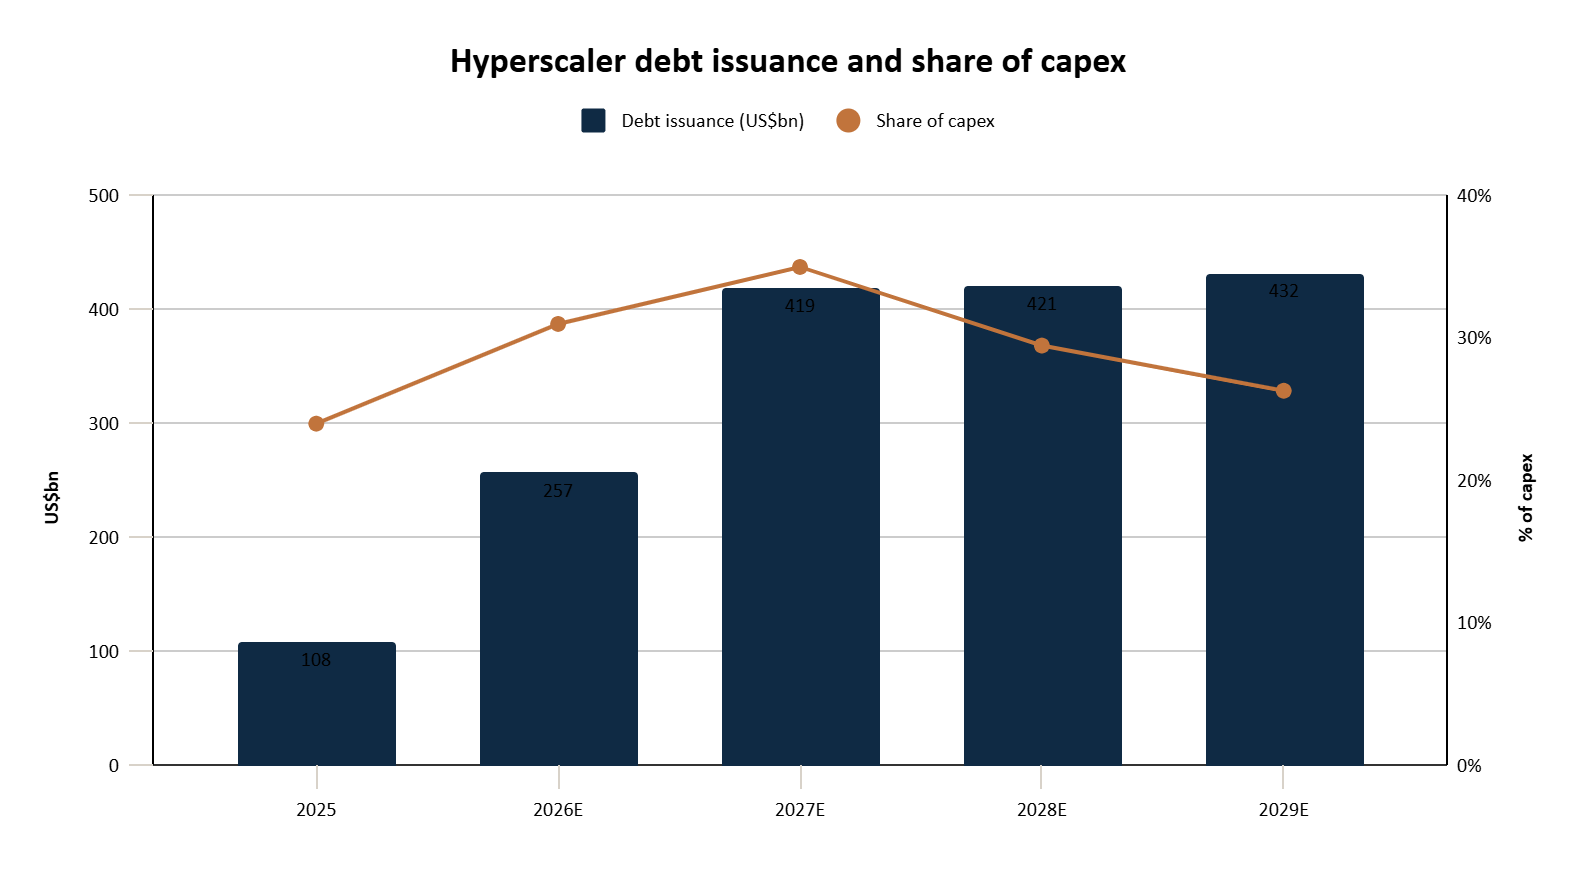
In 2025, the five companies issued a combined $108 billion in debt (24% of Capex). At that time, apart from Oracle, everyone’s FCF was still positive — they started borrowing while cash flow was still positive, raising funds in advance to lock in the money while conditions were good.
For 2026/2027, debt issuance is estimated at $257 billion / $419 billion (31% / 35% of Capex).
For 2028/2029, it’s $421 billion / $432 billion — roughly flat, no longer accelerating.
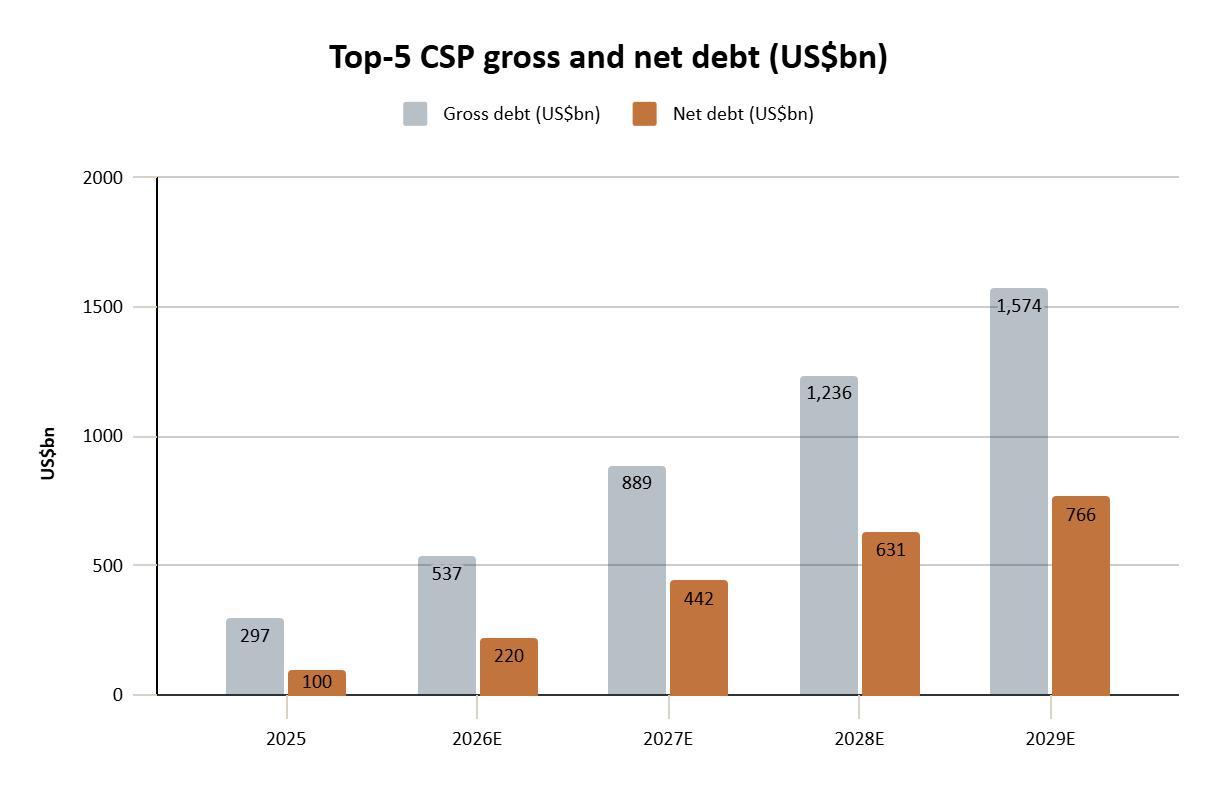
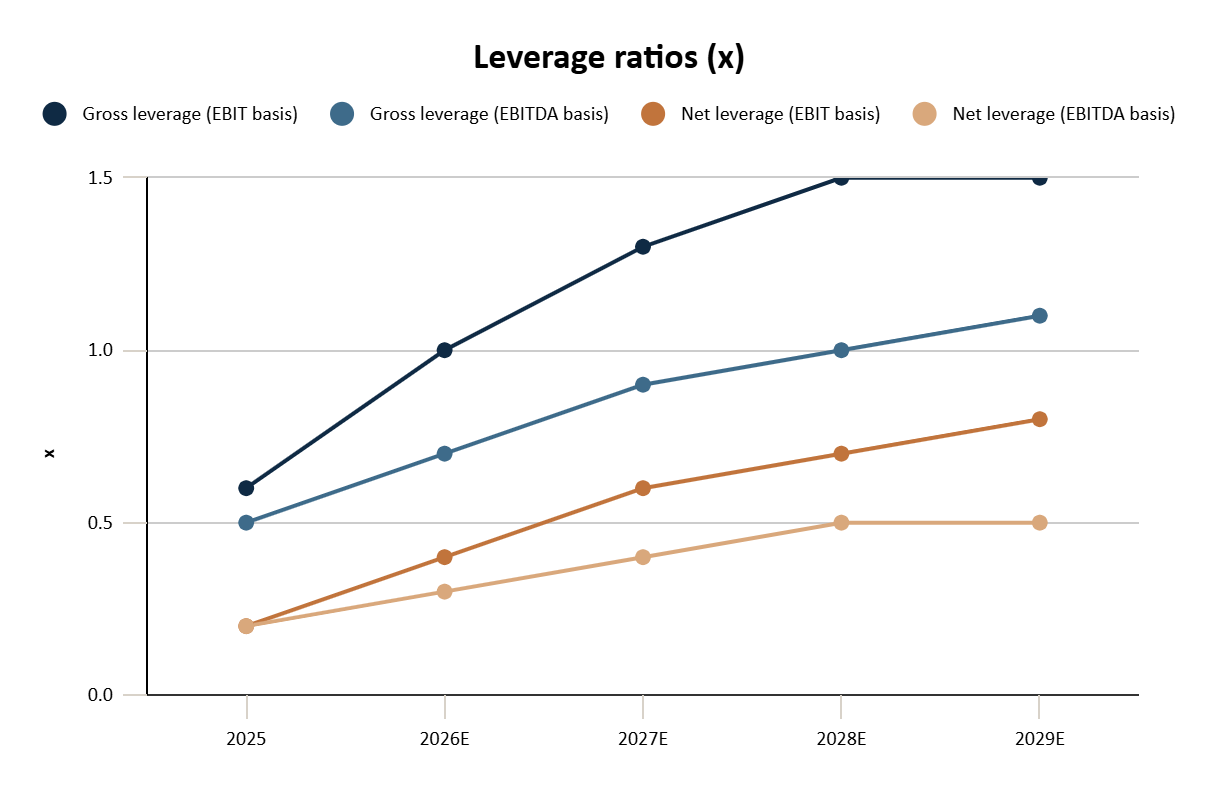
Although total debt is accelerating — ballooning from $297 billion in 2025 to $1.57 trillion in 2029, more than fivefold — the denominator (earnings power) is also growing (EBITDA up 18–24% per year). As a result, net leverage (on an EBITDA basis) is only 0.5x even in 2029: net debt equals just half a year of EBITDA. For a typical investment-grade company, 1–3x is normal, so 0.5x is very light.
Other financial metrics
Net debt / shareholders’ equity of 18%: the capital structure is still equity-driven.
Interest coverage ratio dropping from 43x to 16x: it’s falling fast, but “earning $16 to pay $1 of interest” is still very safe.
CFO / debt falling from 2.0 to 1.0: even at 1.0, it means one year of operating cash flow could pay off all the debt.
What does the market care about?
Bond market appetite: with just these few issuers flooding the market with debt, will the investment-grade bond market struggle to digest it (an issuer-concentration problem)?
Spread widening: the market is already charging a higher price — 2–4 year spreads went from 30 to 40 bps, 5–7 year from 50 to 60 bps, and 20-year-plus from 108 to 118 bps. It’s not yet at a dangerous level, but borrowing is indeed getting more expensive.
Insightology View:
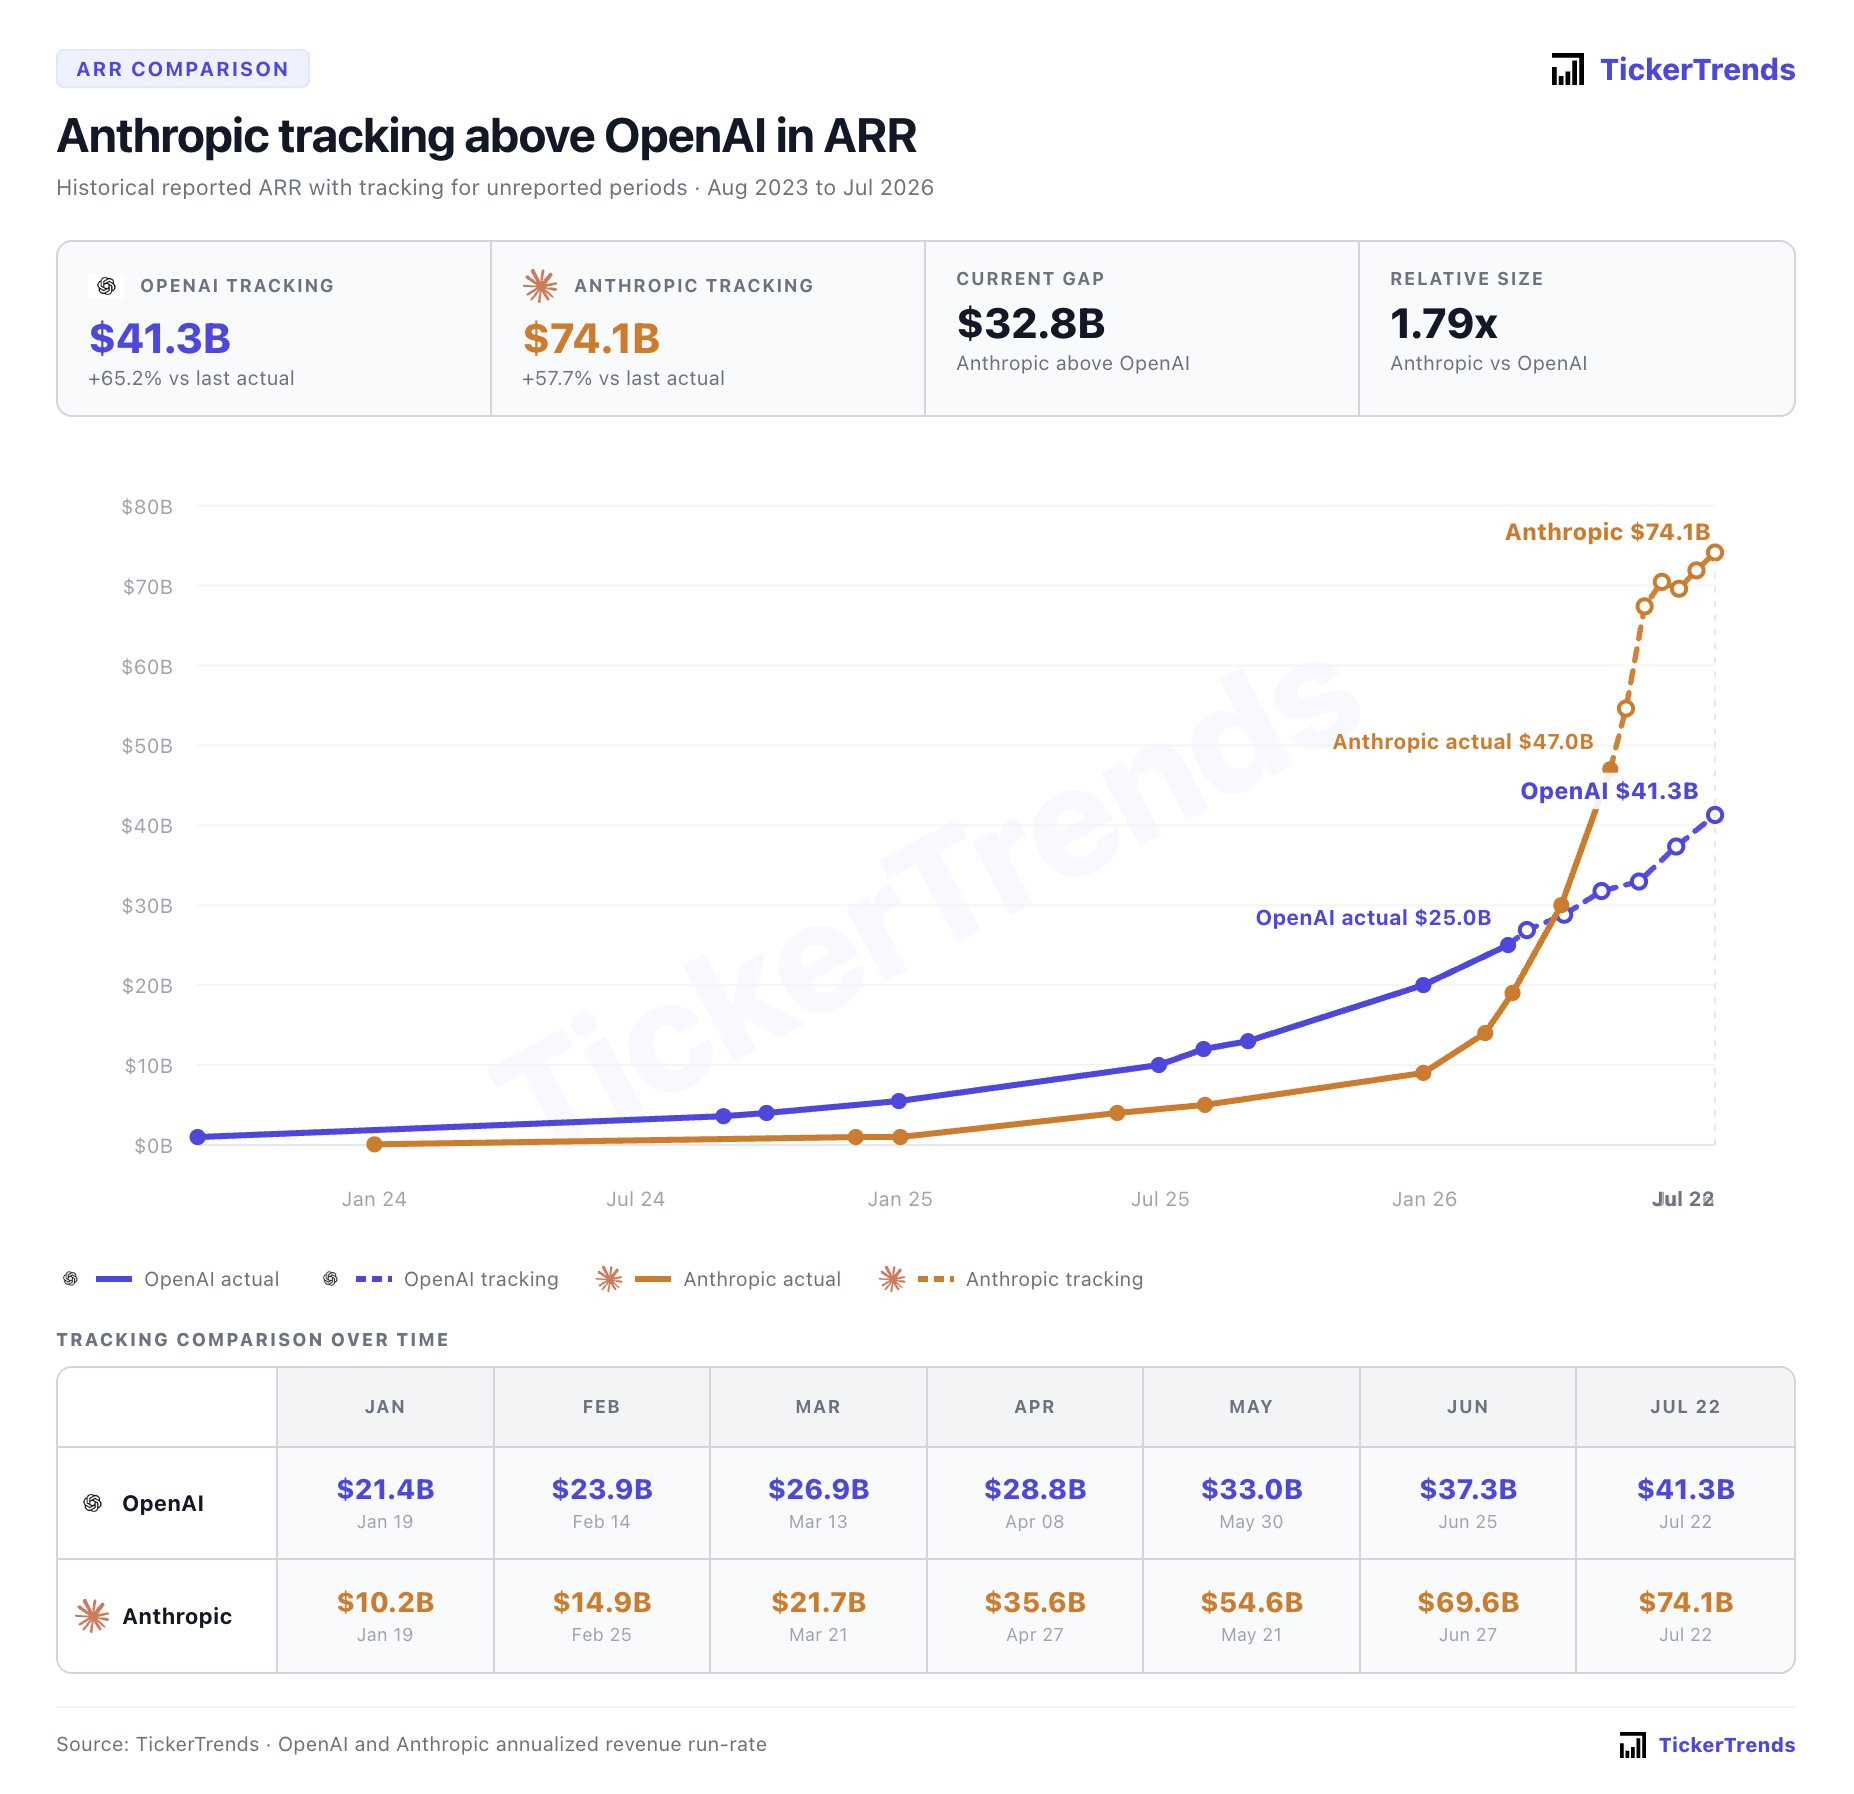
All of this debt and borrowing rests on the assumption of EBITDA growth of around 20% per year — in other words, on AI actually being monetized, and monetized quickly. If monetization starts to slow in the future (the entry of Chinese LLMs into the competition is one risk worth watching), then the entire financial structure would look very bad. From third-party sites, we can see that Anthropic’s and OpenAI’s ARR are still rising, but if their growth slope starts to flatten, the impact on the market would be far greater than this round of deleveraging.

NPO back in focus
In terms of major industry news over the past week: according to the latest disclosures in August 2026 from outlets such as The Information and Korea’s Chosun Ilbo, Nvidia is considering a significant cut to the high-bandwidth memory (HBM) capacity of “Rubin Ultra,” its next-generation AI chip slated for a 2027 launch — a move the industry has described as entering a “Memory Diet” phase.
We believe that while this does affect memory, the real beneficiary is actually NPO. With less memory, each individual GPU has less data readily on hand, so running large models becomes slower. It's like shrinking the personal toolbox each worker carries around — work efficiency takes a hit. Nvidia's compensating approach isn't to add the toolbox back (that would only be more expensive), but to let more workers communicate in real time and share tools within the same space.
Two ways to make an AI server bigger:
So interconnect is back on the table and deserves more attention. AI server interconnect can be divided into two types:
Scale-up: link a group of GPUs together fast enough that they can be treated as one giant GPU. The NVL72 is exactly this — 72 GPUs in one rack, used as a single machine.
Scale-out: many such machines are then combined into a cluster, but communication between racks is much slower — like making a phone call across floors.
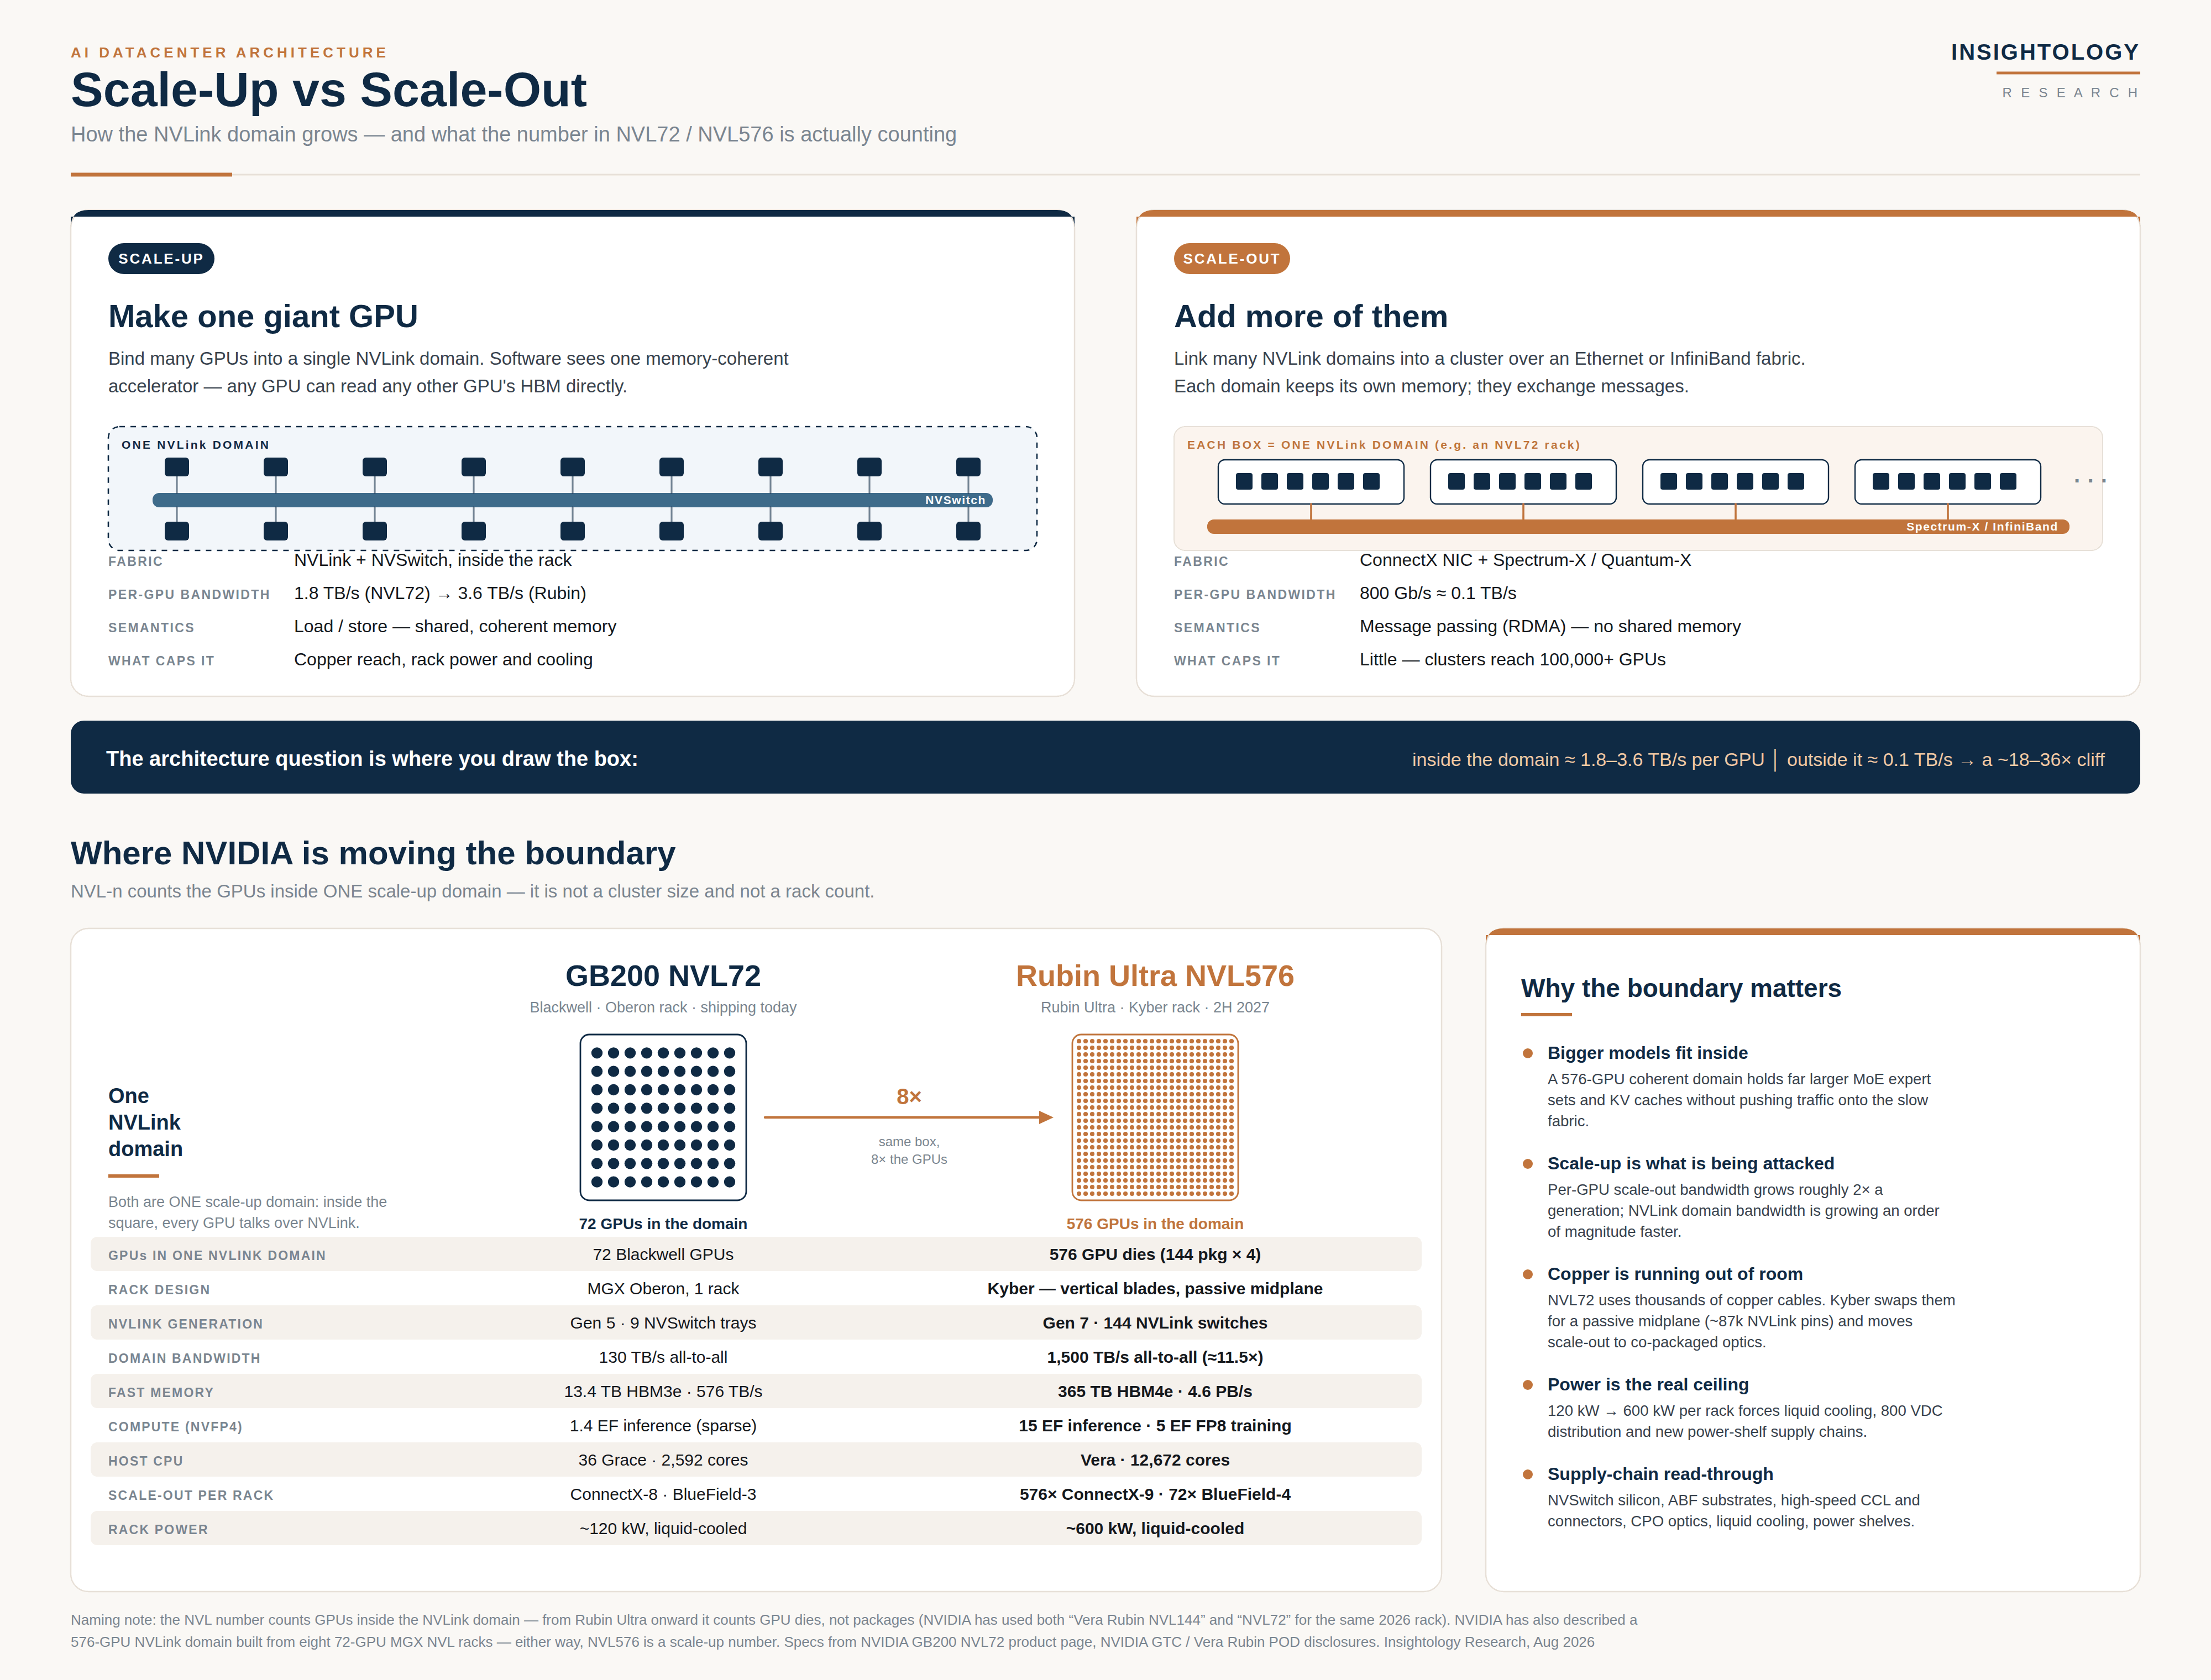
NVL576 favors MoE computation: In its GTC 2026 roadmap, Nvidia showcased the NVL576 — connecting 8 NVL72 racks together via scale-out. This benefits the efficiency of MoE (mixture-of-experts) architectures, because MoE models are made up of many "expert sub-models" that divide the work. These experts are spread across different GPUs and need to exchange data frequently, so the larger the open space and the smoother the communication, the more the drawback of reduced memory gets partly offset.
NVL576 requires optical connections: Inside a single rack, copper wiring (NVLink) between GPUs is enough. But copper has physical limits: as distance grows, the signal attenuates and power consumption spikes, so it basically can’t hold up across racks. To connect 8 racks into one unit, the only option is to go optical — fiber transmits over long distances, offers high bandwidth, and has low loss. So an optical scale-up fabric is the prerequisite for the NVL576 to work.
Within optics, NPO is currently the reliable medium-term path, and CPO will be the ultimate architecture — but the one ramping up first is NPO.
There are two ways to fit the optical engine (OE — the module responsible for converting between electrical and optical signals) into the system:
CPO (co-packaged optics): the optical engine is packaged directly next to the switch chip, almost soldered together. The upside is the lowest power consumption and lowest latency — in theory the fastest and best architecture; the downside is that advanced packaging is too complex and yields are currently low.
NPO (near-packaged optics): the optical engine sits on a substrate near the chip, connected via a socket. It captures most of the benefits of optics, but with far better manufacturability and deployment flexibility — if it breaks, you can still swap it out. In short, it’s a modular engine that’s easier to assemble and repair.
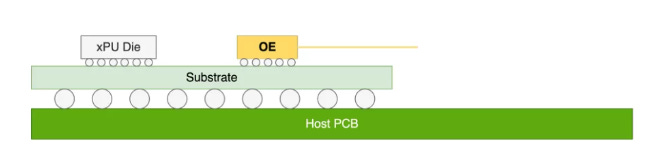
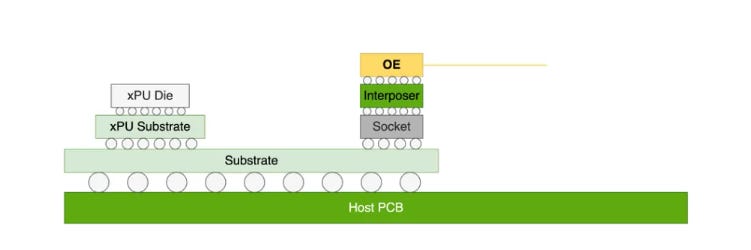
Source:https://www.naddod.com/blog/optical-interconnect-technology-analysis-lpo-npo-cpo
Insightology View:
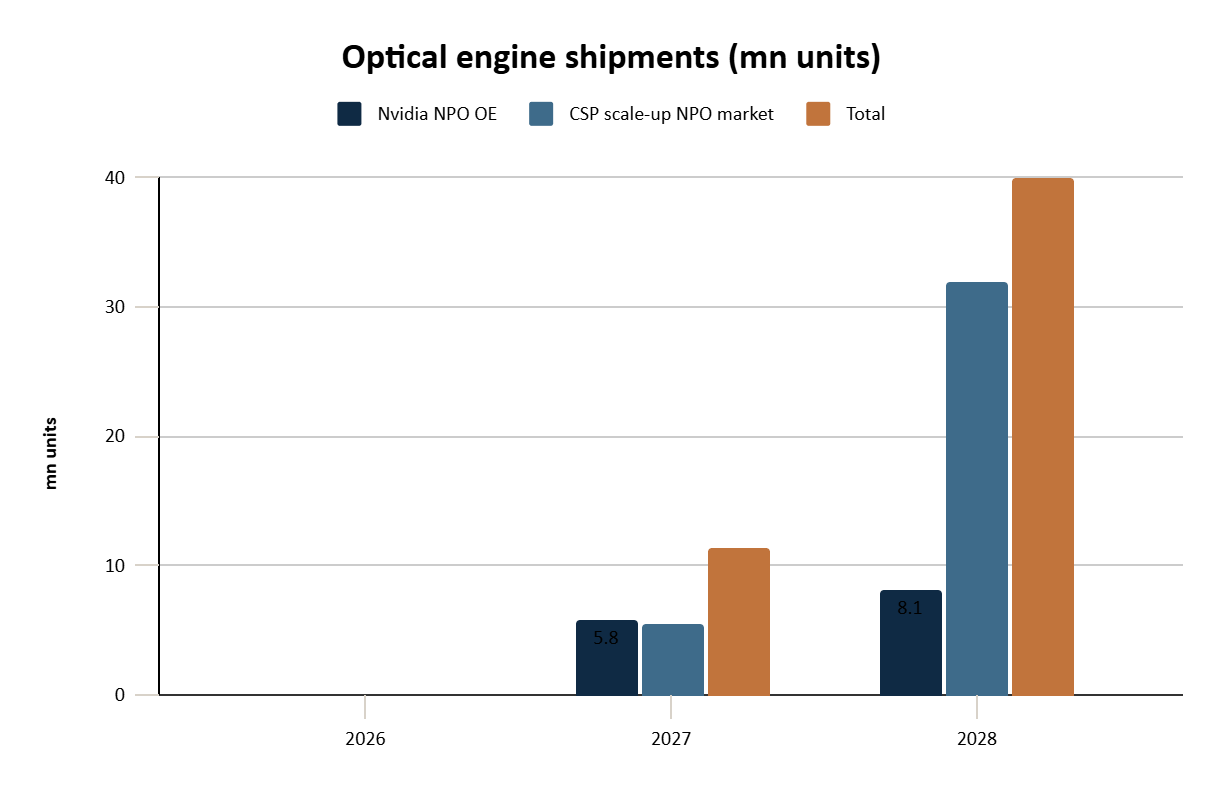
Nvidia is expected to adopt NPO for scale-up in the Rubin Ultra and Feynman platforms. Assuming a 20% penetration rate in 2027, we estimate OE shipments for Nvidia’s platform of 5.6–6.0 million units in 2027 and 8.0–8.2 million in 2028. Adding in the in-house chip platforms of other CSPs, the overall OE market comes to 10–12 million units in 2027 and 40 million in 2028 — YoY growth of nearly 300%.
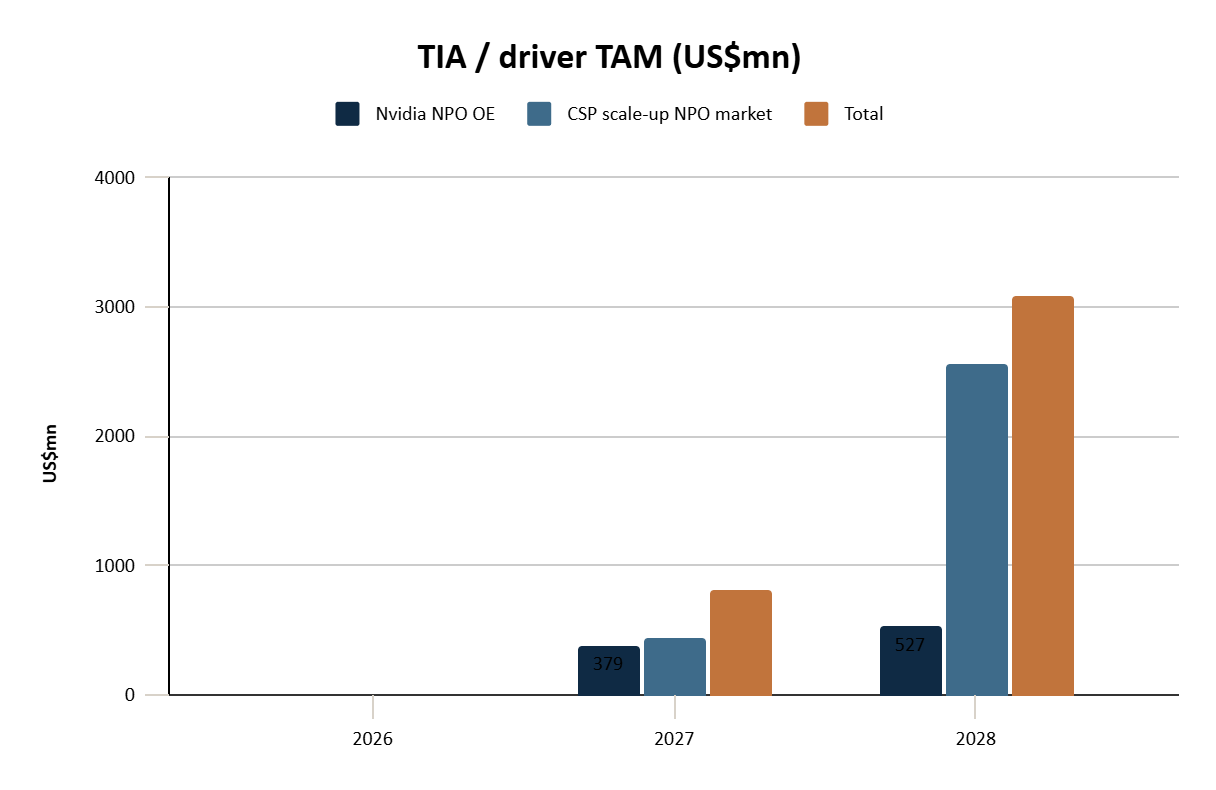
Details on the value shift to TIA/Driver: NPO removes the DSP (digital signal processor) portion from the optical module, handing the signal-conditioning work over to the TIA (transimpedance amplifier) and the laser driver. Together, these two components are worth tens of dollars in each 3.2T optical engine — considerably more than in a traditional pluggable optical module. The TAM for TIA/Driver comes to $800–900 million in 2027 and $3.0–3.1 billion in 2028, again close to 300% annual growth.
Ranking of beneficiaries: Marvell is the primary beneficiary (best positioned in high-speed TIA/Driver), with Semtech secondary. Among others, LITE, SMTC, TSEM, Bizlink, and Browave will also benefit from the NPO ramp.
What I read:Risk and Reward
This book is perfect to pick up and read every time the market drops or spikes — it settles the FOMO mindset, and the urge to sell right at the very bottom.
I finished this book once in the first quarter of this year, and I reviewed it again last month. Each time, it felt different.
This time, Chapters 12 and 14 left the deepest impression on me.
Volatility Is a Feature, Not a Bug
The stock market is the world’s best “reverse casino”
Casino vs. stock market: In a real casino, because of the “house edge,” the more a player plays, the more they lose. The stock market is the opposite — the longer you stay in, the better your odds.
93% of the time you’re watching your assets shrink: This means that for as much as 93% of the time, an investor’s account is in a “drawdown state,” sitting below its all-time high.
Detailed drawdown-frequency statistics (1950–2024):
Drawdown of 10% or more: 36.1% of the total time (more than a third of the time).
Drawdown of 20% or more: 16.4% of the total time.
Drawdown of 30% or more: 5.4% of the total time.
Drawdown of 40% or more: 2.3% of the total time.
Drawdown of 50% or more: 0.1% of the total time.
If an investor can’t tolerate their account being underwater so much of the time, they’re destined not to survive in the stock market.
The illusion of the “average return”: stock market returns are extremely uneven and lumpy
The mean is just a mathematical abstraction: The average annual return of U.S. stocks over the past century is roughly 10%. But in reality, the market never obligingly hands you 10% every year.
Extreme years make up the average: Across the 97 years of history from 1928 to 2024, only 3 years had an actual return between 9% and 11%.
The real distribution of annual U.S. stock returns over 97 years:
73% of the time (71 years): the annual return was positive.
27% of the time (26 years): the annual return was negative.
70% of the time (68 years): the annual return was a double-digit surge or plunge.
58% of the time (56 years): the annual return was a double-digit surge (>10%).
43% of the time (42 years): the annual return was an extreme surge or plunge of 20% or more.
This means the market’s normal state is “extreme surges and plunges alternating (lumpy returns),” rather than mild, average growth.