

Life
It’s been six months since the last Weekly Shot, and I’m finally back. Work kept me busy this past half year, and a lot of what I was writing and sharing just wasn’t the right fit to put out publicly. But I’ve found a balance that works: the more valuable material goes behind the paid tier, and I’ll get that paid tiering sorted out over the next few days.
Through all of it I’ve kept doing the same research on tech stocks and the broader economy, and I’ve spent a good amount of time talking with experts inside the industry, getting a closer look at how things really work. I love being in this mode. There’s so much new out there worth exploring and building.
Going forward, this space will carry updates from the companies I follow closely: their transcripts, the various forums, media coverage, and more. It won’t be limited to tech either. Any topic worth studying over time, I’m more than happy to share it here.
One thing to bear with me on: a lot of what I have right now can only be estimated from public data. Whatever I’m able to disclose from my expert interviews, I’ll bring out in the paid membership.
Charts Speaks
Every day we look at a huge number of charts. Each week we’ll put a few here to walk through what we’re seeing.
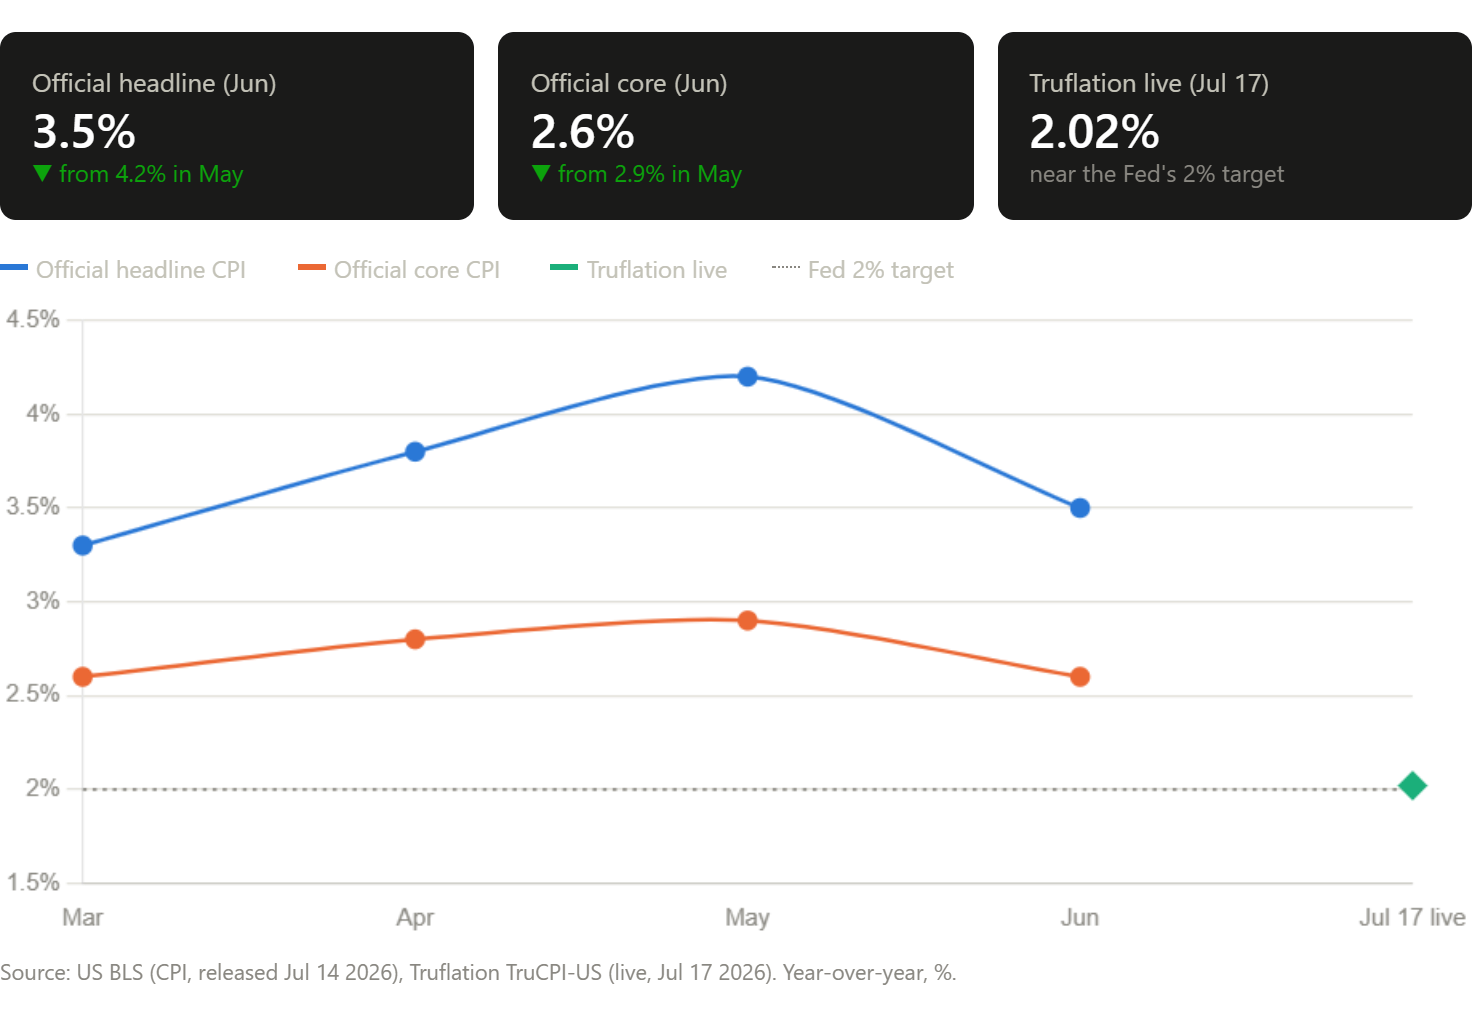
On July 14, 2026, the US reported that the June 2026 CPI year over year rate fell sharply from 4.2% to 3.5%, below the 3.8% the market expected. Core CPI year over year also eased from 2.9% to 2.6%, under the 2.8% consensus. The reason for the pullback is simple: energy. June energy costs rose 15.7% year over year (down from 23.5% in May), and gasoline’s year over year gain dropped from 40.5% in May to 26.7%. The driver was the ceasefire between the US and Iran and the reopening of the Strait of Hormuz, which reversed the oil price shock from earlier in the year.
We think the Fed will hold rates steady at the July 2026 FOMC meeting, buying more time to watch how genuinely inflation is cooling. And if the US and Iran get back to talks and things go well, commodity inflation should keep coming down, which leaves the door open for the Fed to hold rates flat through the end of 2026. On top of that, the five major reforms the Fed has proposed are set to wrap up discussion by year end, and could still lay the groundwork for structural rate cuts over the longer term.
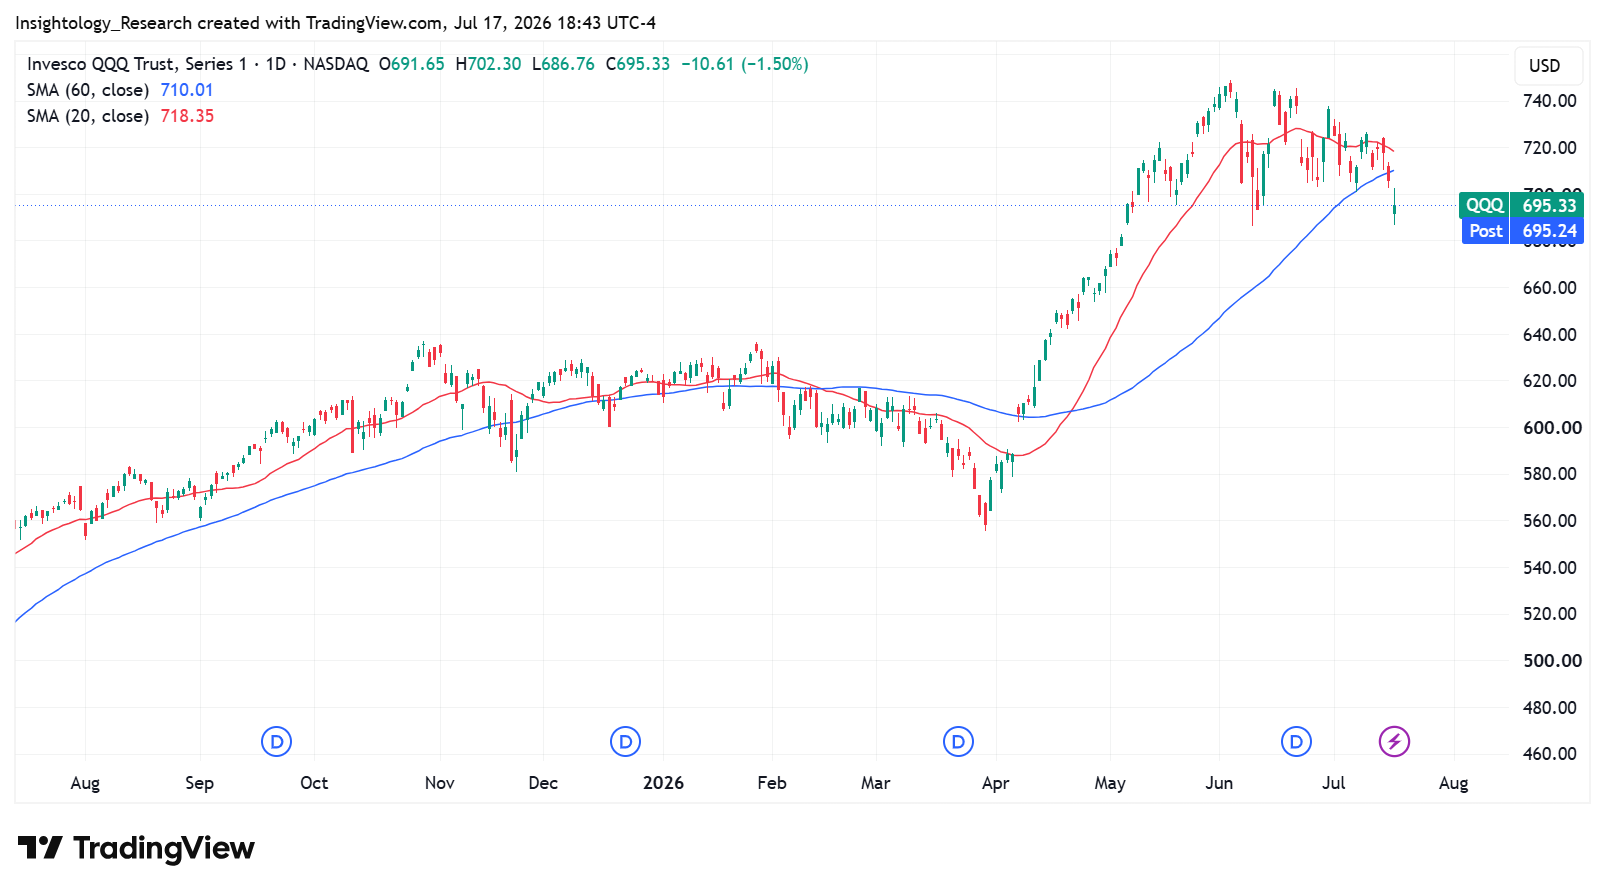
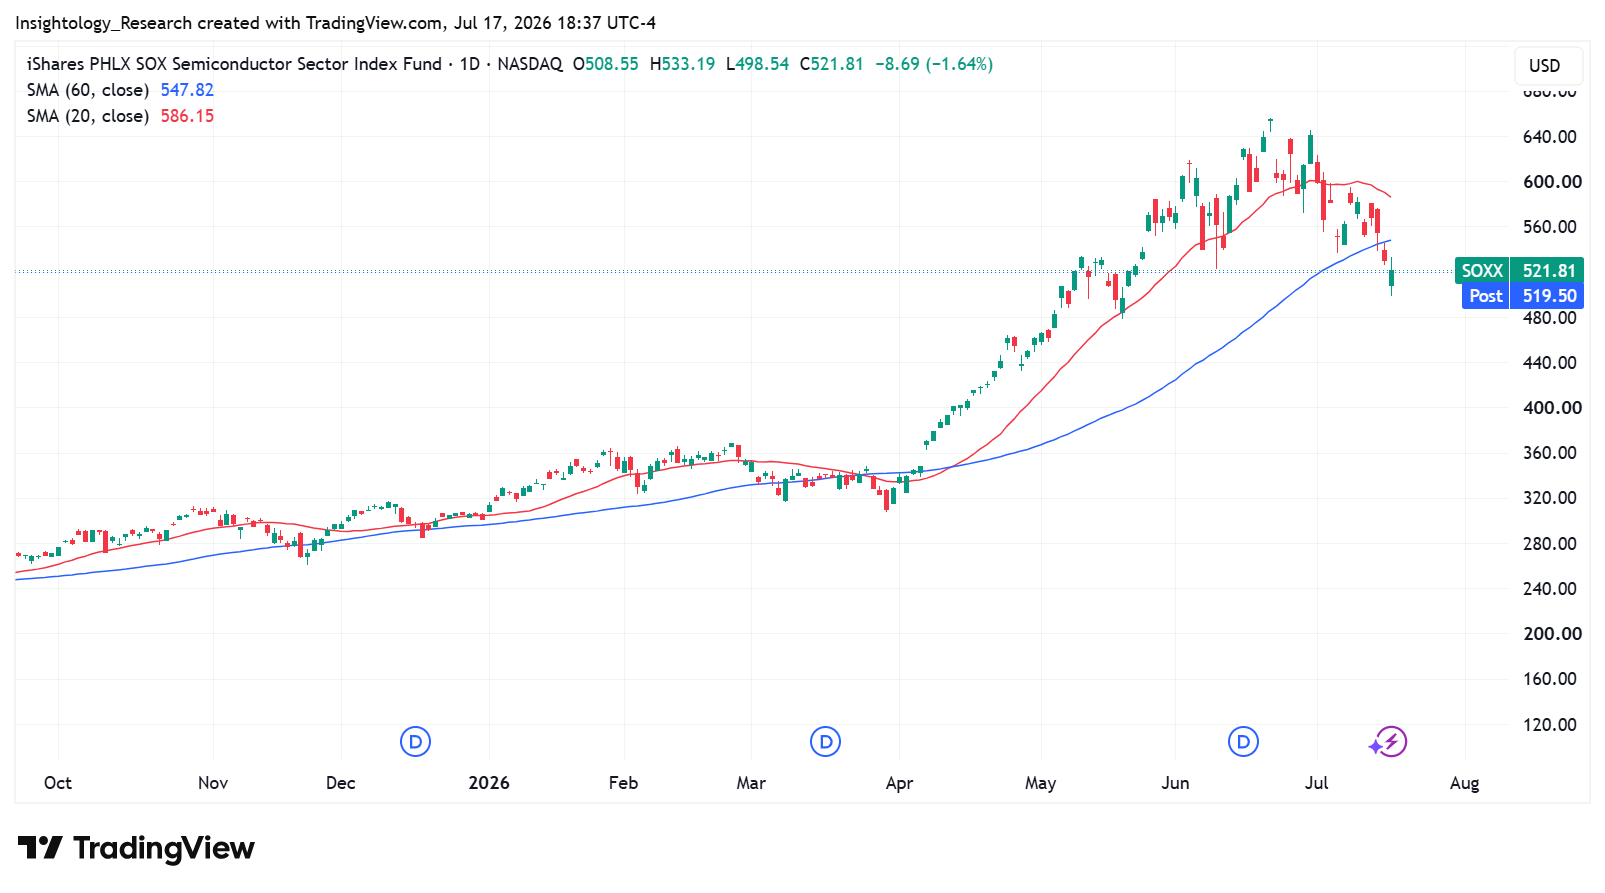
The Nasdaq and the Philadelphia Semiconductor Index have already broken below their quarterly moving averages, which for the tech market is a signal of a medium term consolidation. Look closely at the components and you’ll see Korean memory names deleveraging and getting marked down on valuation. But we’re not going to force the call that it’s time to buy the dip, because we don’t know what other horror stories might come out one after another. We’ll keep respecting the market.
And because the market has started to come down a bit, now is the time for us to spend more effort on the semiconductor space. It means some good names may be getting sold off with the bad.
When the Semis Lose the 60 Day Line
Both the Philadelphia Semiconductor Index and QQQ closed below their 60 day moving averages this week. Before deciding what that means, I went back and tested every single break in the historical record.
First, a definition. Most breaks of the 60 day line mean nothing. In our sample, roughly two thirds get reclaimed within five trading days, the classic whipsaw. So I call a break an **effective breakdown** only when the index closes below the 60 day average and stays below it for more than five trading days. That one filter changes the picture completely.
Here is what effective breakdowns have looked like:
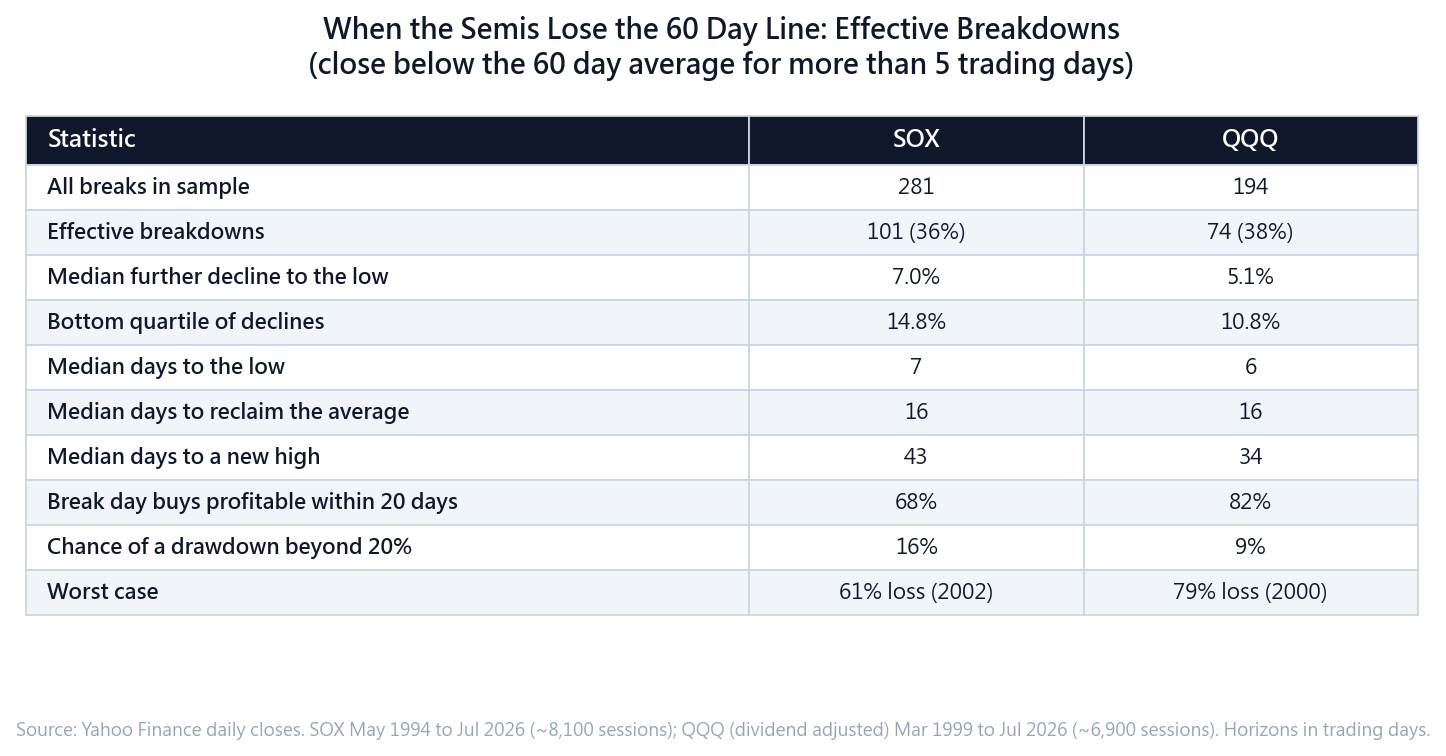
Two things stand out. The typical effective breakdown resolves fast: the low arrives within a week or two, the average gets reclaimed in about three weeks, and a new high follows within two months. The problem is the tail. Once a breakdown stays in force for more than 20 trading days, the median further decline grows to 18% for SOX and 12% for QQQ, and only one in four break day buys in SOX turns profitable within a month. Every catastrophic case (2000, 2002, 2008) started out looking like all the others.
So an effective breakdown is not a sell everything signal. It is a respect the tape signal: median outcomes stay mild, but tail risk roughly triples the moment the line stays lost for a week.
**Data notes.** Daily closes from Yahoo Finance. PHLX Semiconductor Index (^SOX): May 1994 through July 2026, about 8,100 trading days. Invesco QQQ Trust, dividend adjusted: March 1999 through July 2026, about 6,900 trading days. Effective breakdowns cluster in 1995 to 1998, 2000 to 2002, 2008, 2011, 2015, 2018, 2020, 2022 and 2025. All horizons are in trading days. Past performance, not prophecy.
Quotes from company
Beyond the charts, what companies say and how they say it is another place we keep piecing insight together.
This week kicked off Q2 earnings season: the four big banks and AEHR (07/14), JNJ (07/15), TSMC’s call and Netflix (07/16, Netflix after the US close), ASML. The most interesting part is the timing. What the bankers said 48 hours before the correction reads, after the fact, like a preview.
Where the market stands
“It’s getting close to as good as it gets. We just don’t know how long it’s going to last.”
— Jamie Dimon, JPMorgan (JPM) CEO
About as good as it gets, and no one can tell you how much longer it holds.
“The conflict in the Middle East has weighed a bit on global growth whilst giving inflation a second wind... it’s a nuanced story because that growth is not lifting all boats.”
— Jane Fraser, Citi (C) CEO
Growth isn’t reaching everyone evenly. A K shaped split, now officially confirmed.
“...in many ways, we’re still just getting started as a company... We’re under 45% penetrated into addressable households around the world... We’re capturing, we think, just 7% of addressable revenue market.”
— Spence Neumann, Netflix (NFLX) CFO
Read it next to Dimon’s line: one says the economy is about as good as it gets, the other says the company is only getting started. Penetration under 45%, just 7% captured of a $670 billion addressable revenue market, and roughly 5% of global TV viewing share. Where you are in the cycle and how long the structural runway runs are two different things, and both can be true at once.
Demand on the AI supply side is still being revised up
“I believe from this day on all the way to probably 2029, 2030, the demand is very strong. Whether in between there’s a dip or not, I’m not very sure. But the trend is so robust that I believe we are witnessing a kind of a new industry.”
— C.C. Wei, TSMC (2330-TT/TSM-US) Chairman & CEO
Demand runs all the way out to 2029 or 2030, and we’re witnessing a new kind of industry. Whether there’s a dip along the way, he himself says he isn’t sure. That honesty carries more weight than the optimism does.
“So if you’re asking about the AI’s CAGR, let me give you not a number, but it’s stronger and stronger and stronger. So we don’t give you the number today because it continues to increase.”
— C.C. Wei, TSMC Chairman & CEO
Back in January they gave a five year CAGR outlook for AI revenue, in the mid to high 50s. Pressed on it this quarter, he said stronger three times over and refused to update the figure, because it’s still moving up.
“Last time, we said our CapEx in the next three years will be significantly higher than the CapEx in the past three years. Now the CapEx in the next three years will be even more significantly higher than the past three years.”
— Wendell Huang, TSMC CFO
From significantly higher to even more significantly higher. The wording itself is the guidance.
Leverage has been in plain sight all along
“You can see most of this on a daily basis through volumes of the New York Stock Exchange, the CME, volumes through hedge funds. It’s not a secret. Margin loans.”
— Jamie Dimon, JPMorgan (JPM) CEO
Explaining the 86% year over year jump in equities trading revenue, Dimon pointed straight at margin loans. Leverage was never a secret. It’s just that no one wants to look at it while things are going up.
“Do we see some excesses on outside? We always do. A lot of that went to a different market, not in the banking system. Some of that’s come back and now they have to do it more on bank lendable terms...”
— Brian Moynihan, Bank of America (BAC) CEO
The excess leverage moved outside the banking system (private credit), and some of it is now flowing back, forced to be redone on terms banks will accept.
“We didn’t talk about a huge deterioration in credit underwriting standards... a very mild one... I think there’ll be some outliers out there, just like there were, by the way, in the great financial crisis.”
— Jamie Dimon, JPMorgan (JPM) CEO
Credit standards have loosened, but only mildly. When the cycle turns, though, it won’t be a normal distribution. There will be outliers.
The consumer is still holding up
“Consumer spending has recently expanded and continued to outperform our expectations... the spending picked up during the second quarter and now is running at 6%+ year-over-year comparison.”
— Brian Moynihan, Bank of America (BAC) CEO“When you look at the delinquencies and the net credit losses... both delinquency and credit losses are down year-over-year.”
— Gonzalo Luchetti, Citi (C) CFO
Card spending is accelerating (6%+), while delinquencies and credit losses are falling. No cracks on the consumer side right now.
“...they pay the least per hour of viewing compared to comparable SVOD offerings. In some cases, they would have to pay twice as much per hour for a competitive service.”
— Greg Peters, Netflix (NFLX) Co-CEO
Price increases in the US, Mexico, and Spain in the first half played out consistent with the past, with no unusual churn. Consumers can still take a price hike.
Insightology View
The biggest scare in the market this week was the valuation reset and deleveraging trade in Korean memory. Memory is about half of the Korean market, so its swings are naturally 2 to 3 times those of other markets. On top of that, retail piled on margin and leveraged ETFs, stacking leverage to an estimated 9 to 10 times. Once forced liquidation kicks in, the selling turns into a stampede that spills over to the rest of the world. But what matters more to us is what the world looks like 18 months out. Without a correction there’s no opportunity.
For the next 18 months, we think TSMC’s guidance on this call is a useful reference: over the next three years, both CapEx and revenue growth will be significantly higher than the past three years. The company even noted that AI demand will run through 2029 and 2030.
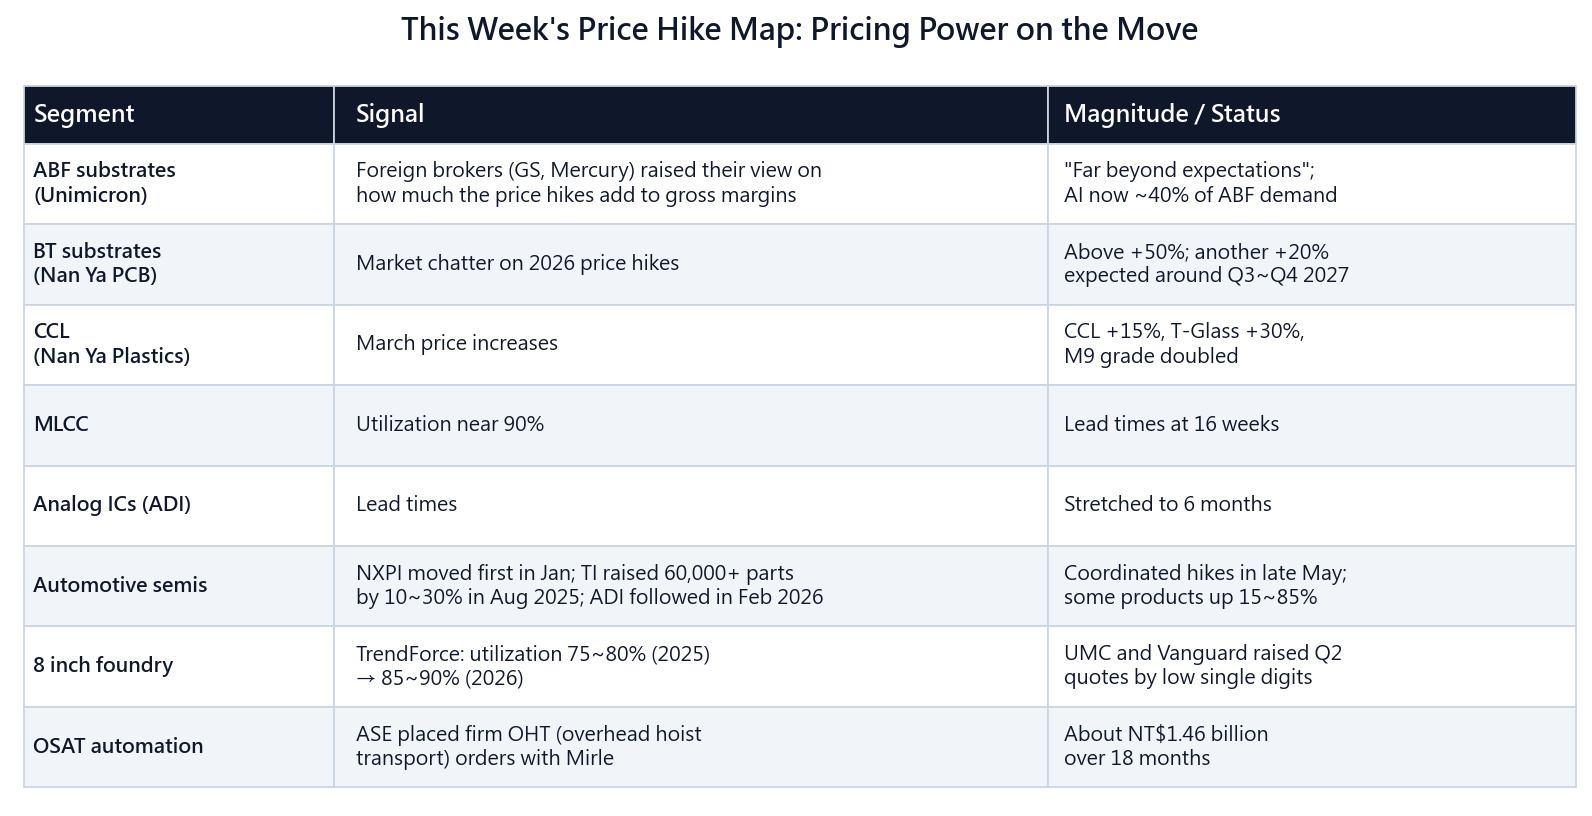
Across the four quarters from the second half of last year to the first half of this year, the surge in AI demand rippled through the supply chain and set off a bullwhip effect. We’ve also mapped out the price increases across the entire supply chain.
Company Updates
These are some of the companies we stay most constructive on. The table makes its debut in the next issue: a rolling list of roughly 20 to 30 names, most of them US listed, refreshed every week. Down the road we’ll add financial models and valuation updates for these companies.
Disclaimer: This newsletter reflects personal views and information gathering only, and does not constitute investment advice. Companies mentioned are for illustration purposes only. Please do your own research and make your own investment decisions at your own risk.